Transforming images into networks
![]() Trying to come up with a cool visualization for a small side-project, i was contemplating how to draw, or approximate, an object using networks.
During my creative process i remembered my colleague and friend Piotr Sapiezynski once told me how he once did something similar (see here and here).
Thinking his visualizations look absolutely stunning i tried to do my own version.
Trying to come up with a cool visualization for a small side-project, i was contemplating how to draw, or approximate, an object using networks.
During my creative process i remembered my colleague and friend Piotr Sapiezynski once told me how he once did something similar (see here and here).
Thinking his visualizations look absolutely stunning i tried to do my own version.
The procedure is actually quite simple:
- Find an image, png or jpeg
- Sample pixels from the image according to some probability (use these as nodes)
- Connect nodes according to a heuristic (e.g. k-nearest neighbors)
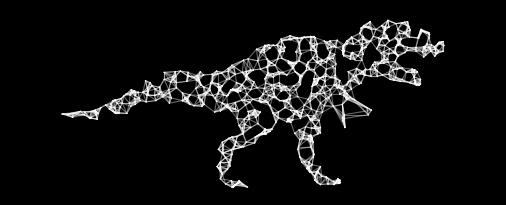
Using these 3 simple steps you can create stunning visuals like the t-rex and other examples below. (Also check out the visuals i created for the Complex Science for the Most Vulnerable session at CCS2018).
As usual you can find the code further down.

Code
Lets first import some packages and define some functions. Note, I have been trying to switch to python 3.6, but below code is in python 2.7.
import numpy as np
import matplotlib.pyplot as plt
from scipy.ndimage import imread
from scipy.spatial import cKDTree
import random

# function to transform color image to grayscale
def rgb2gray(rgb):
    return np.dot(rgb[...,:3], [0.299, 0.587, 0.114])

def rgb2hex(color):
    '''
    Matplotlib scatter is not happy with rgb tuples so we need to transform them to hex
    '''
    c = tuple([np.int(255 if c == 1.0 else c * 256.0) for c in color])
    return "#%02x%02x%02x" % c
In order to sample pixels from an image we first need to set some parameters. Its possible to write an algorithm that estimates the best parameters for each figure, but as i was too lazy, so you will need to experiment a bit instead.
# parameters
p = 0.03 # propability of selecting a pixel/node
k = 5 # number of connections pre per pixel/node
pix_threshold = 0.9  # remove values above this value 0 (white) - 255 (black) OR 0 (black) - 1 (white)
Now, find an image and load it using python. It can be an image of anything, even a png/jpeg of some text. In this example we will focus on the outline of a robot (see below).
# load image
#data = plt.imread('in/atlas.png')
data = plt.imread('in/test.png')
y,x = np.where(rgb2gray(data[:,:,:3])<pix_threshold)
y_norm, x_norm = map(float,data[:,:,0].shape)
colors = data[:,:,:3]

# if its a large image it might be a good idea to downsample
# y,x = np.where(rgb2gray(data[::3,::3,:3])<pix_threshold)
# y_norm, x_norm = map(float,data[::3,::3,0].shape)
# colors = data[::3,::3,:3]
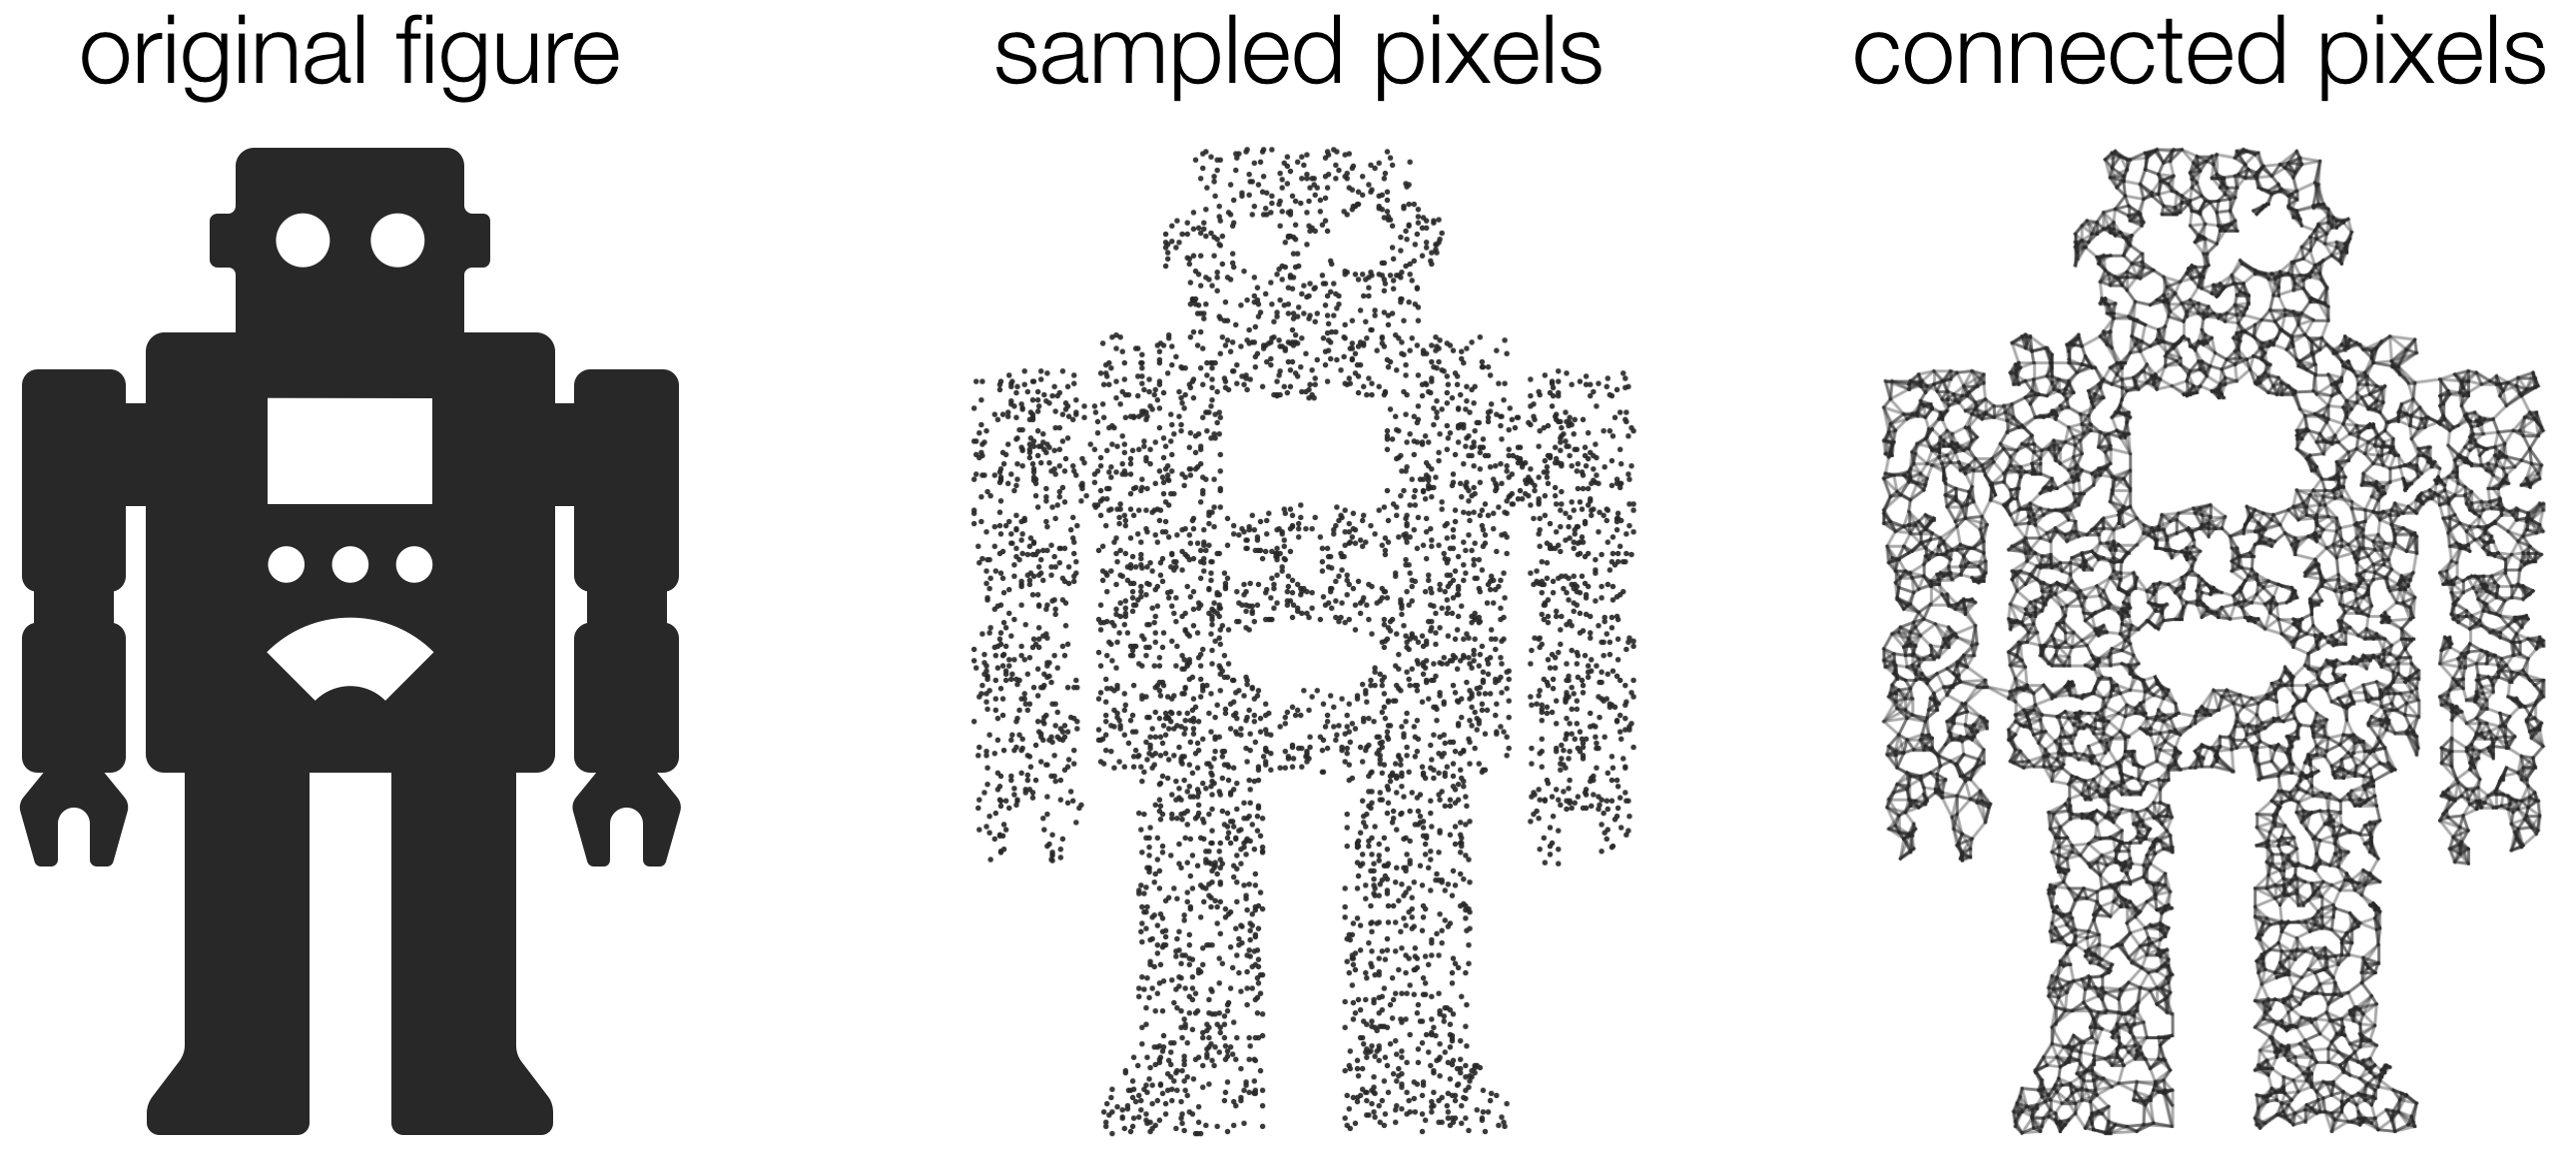
Given the image, sample pixels according to some probability. Here we sample pixels at random, you can also apply a different heuristic. After selecting the nodes, lets connect them. Again you can do this using different methodologies, here i connect each node to its k-nearest neighbors, using a KDTree.
# select nodes
X = np.array(random.sample(zip(x,y),int(len(y)*p)))*1.0

# find k nearest neighbors using scipy.spatial.cKDTree
tree = cKDTree(X)
Given the nodes and edges, only thing we are missing is to draw the network. For this i prefer using matplotlib. In below code i only plot edges, nodes are omitted, because i feel it looks prettier. If you, however, want to include nodes just comment-in the lines below.
# construct figure
plt.figure(figsize=(x_norm/120.,y_norm/120.))
ax = plt.subplot(111)

# create lists for position of links
x_ = []
y_ = []

# go through each node and construct links
for pt in X:
    # find k nearest neighbors
    dist, ind = tree.query(pt, k=k+1) # k' = k+1 because method returns points itself
    for kneigh in ind[1:]:
        x_.append([pt[0],X[kneigh][0]])
        y_.append([pt[1],X[kneigh][1]])

plt.plot(np.array(x_).T,np.array(y_).T,color='#282828',lw=0.8,alpha=0.4,zorder=2)

# unpack nodes
# y,x = zip(*X)

# plot using a single color
# plt.scatter(y,x,marker='o',c='#282828',s=0.5,alpha=1)

# or if you want to draw the network with the original colors of your image
# c = [rgb2hex(colors[int(xx),int(yy),:]) for yy,xx in X] # colors
# plt.scatter(y,x,marker='o',c=c,s=3,alpha=1,zorder=3)

plt.axis('off')
plt.ylim(y_norm,0)
plt.xlim(0,x_norm)

plt.tight_layout()
plt.savefig('robot.png',dpi=250,pad=0.0,bbox_inches='tight')
plt.close()