Climate futures

(Disclaimer: This post is also featured on the Data Culture blog)
This summer has been full of heatwaves and new heat records. Europe has had sweltering temperatures, China is experiencing its worst heatwave on record, the US had a major heatwave, and earlier this year heatwaves hit the Arctic and Antarctic at the same time.
Our climate is getting warmer, and it is undeniably linked to our large-scale and continued emissions of green-house gasses. However, how will our current heatwaves compare to the heatwaves of the future? What will our future climate look like, if our societies and policy makers continue on their current course? Intrigued by this question, and inspired by the recent opinion piece in PNAS by Kemp et al. on the Climate Endgame: Exploring catastrophic climate change scenarios, this blogpost looks into future future heatwaves might look.
The Climate Data
To understand the future we use data from the CMIP6 climate models, which are state-of-the-art climate models (CMIP = Coupled Model Intercomparison Projects). For instance, the IPCC sixth assessment report used the CMIP6 models (IPCC = United Nations Intergovernmental Panel on Climate Change). I wont go into detail about the CMIP6 models, as I’m not a climate scientist, but more info can be found here.
The CMIP6 models focus on estimating the climate given 4 different future climate scenarios, also called Shared Socio-economic Pathways (SSP). Each SSP scenario explores how the world might change over the rest of the 21st century, modeling how factors such as population, technological, and economic growth, can lead to very different future emissions and warming outcomes.
We focus on two scenarios, the SSP3-7.0 (or SSP370) scenario which is a middle of the road scenario, and the SSP5-8.5 (SSP585) scenario which is a worst case scenario. We download data from the worldclim website for the two scenarios for years 2021-2100. The site contains rasters for different climate properties, such as the monthly average maximum temperature in Celcius (called tx on the site) , the monthly average minimum temperature (called tn), the monthly total precipitation in mm (pr), and many others. Because we are interested in future heatwaves we only focus on the max temperature (tx) rasters.
The worldclim database contains predictions from 25 models. I am not a climate scientist so I do not know the strengths and weaknesses of each individual model. Instead I have chosen to download the predictions from 4 random models and take their average predictions to smooth out any noise or outlier values. (The models I have selected to work with are: ACCESS-CM2, GISS-E2-1-G, INM-CM5-0, and MIROC6.) If you are a climate scientist, I would love to hear back from you regarding these choices.
Future Heatwaves
So how warm are future heatwaves going to be?
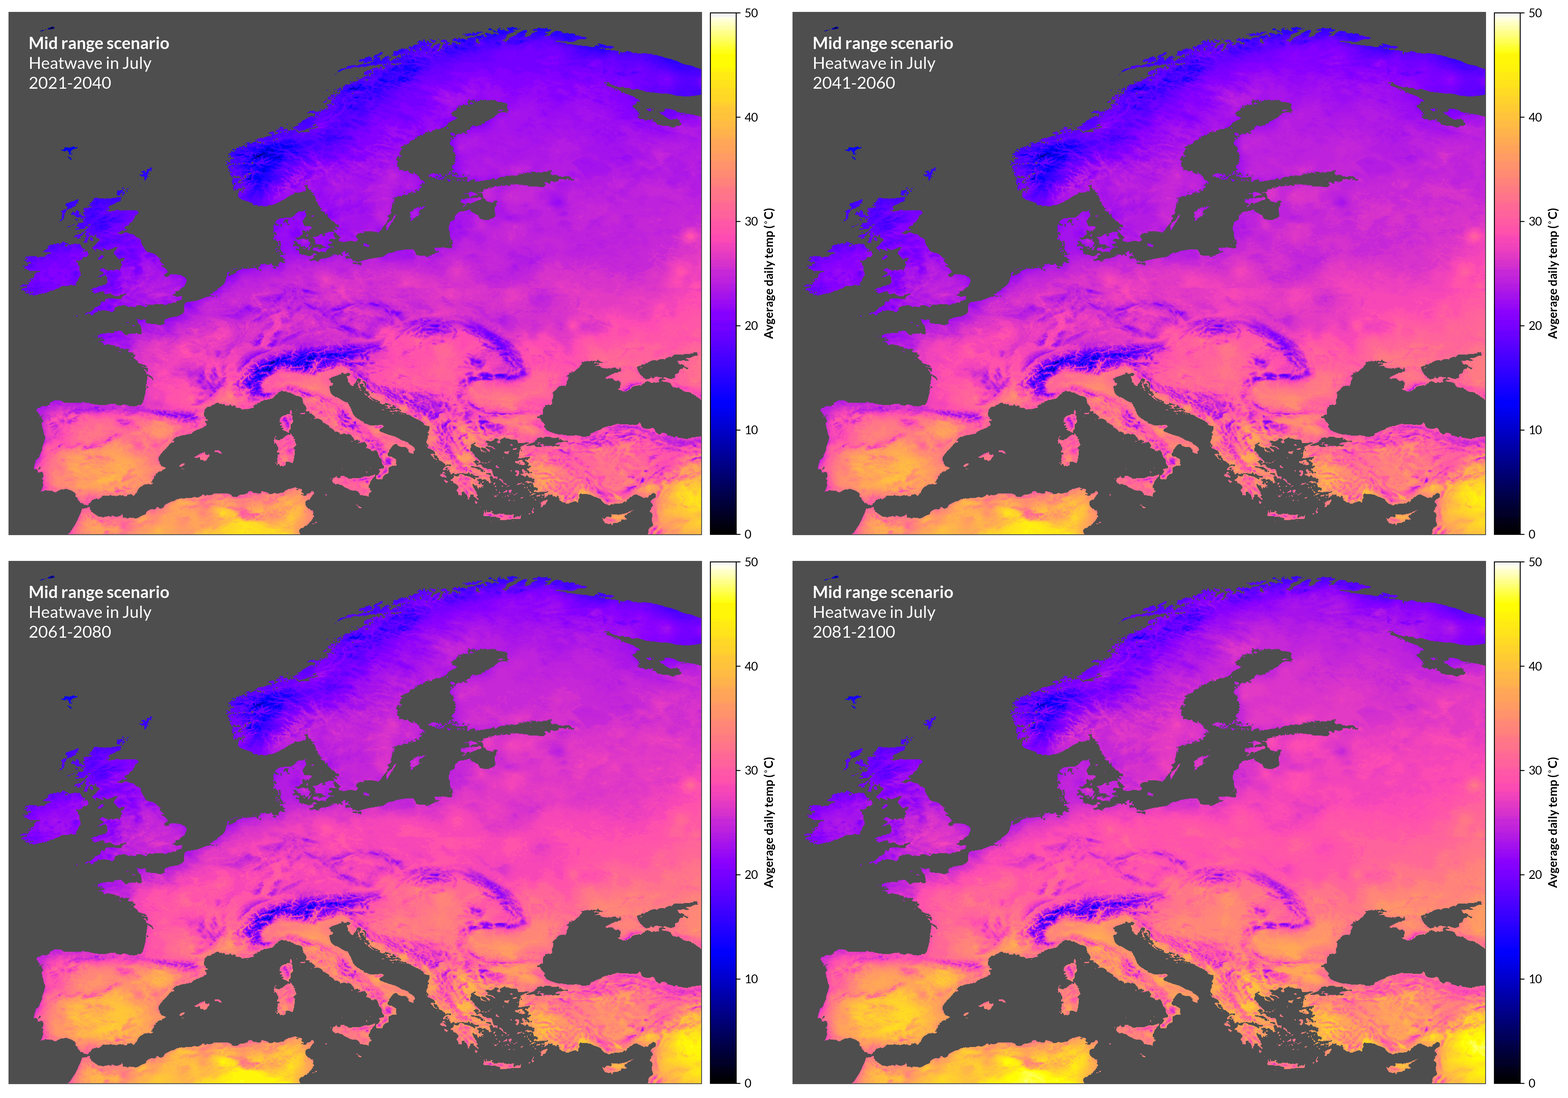
Starting with the mid-range scenario, for Europe the situations looks something like this:

The gif shows the average temperature during the month of July for 4 20-year time-periods, 2021-2040, 2041-2060, 2061-2080, and 2081-2100. The color denotes how warm each region will be, with the color bar on the right showing the temperature. The brighter the color the warmer the temperature. Here we are not talking about the maximum temperature during a day, the bar shows the expected average temperature over a 24-hour period. For instance, this means that in 2081-2100 a heatwave in Rome will result in a daily average temperature of 36°C (or approx. 97°F). Please note that this temperature is average over all 24-hours in a day. So a temperature of 36°C means that is is going to be very hot! To compare, during the July heatwave of 2022 Rome had an average temperature of 30.5°C (according to the weatherspark site, approx 87°F). This is only the mid-range scenario.

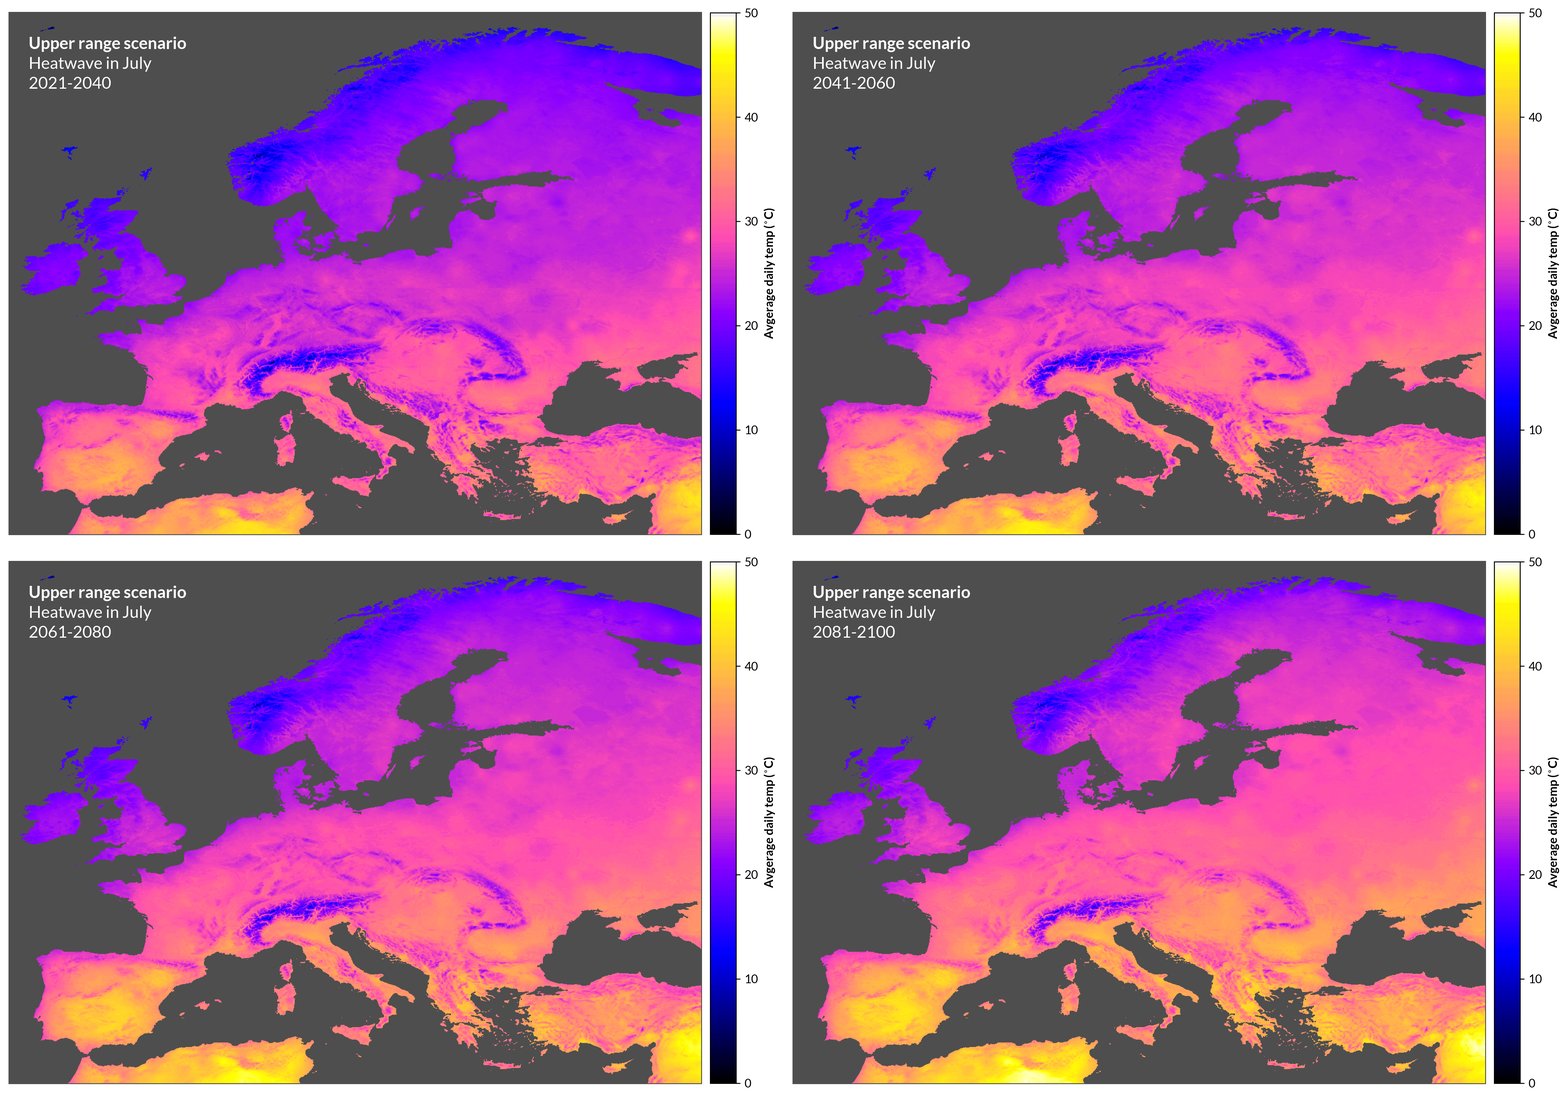
For the worst-case scenario, if we continue business as usual, our future looks much more bleak / warm. People living in Rome during 2081-2100 can expect average daily heatwave temperatures of almost 38°C (100.5°F). The average temperature will feel like you are having a continual fever. It is difficult to get a grasp of the temperature from the gifs so I have also plotted expected temperatures for specific European capitals. Here we can see that Rome is not even the warmest European city. Madrid, for instance, will experience average heatwave temperatures of 41°C (approx. 106°F) during the worst-case scenario in 2081-2100.


Our cities are not designed to be livable under such extreme temperatures. According to WHO heatwaves are among the most dangerous of natural hazards, but rarely receive adequate attention because their death tolls and destruction are not always immediately obvious. In fact, numbers show that the recent heatwave in Spain and Portugal killed more than 2000 people. Future heatwaves will be much worse.
