Eurovision & Data Science

Last weekend was Eurovision. You know Eurovision, right? Its a music contest with more viewers than super bowl! As an ardent supporter, and person who has seen the last 25 Eurovisions (at least), I was also tuned in this year.
TLDR; Sweden and Loreen won 🇸🇪🍾 beating crowd favourite Finland and Käärijä 🇫🇮💚 However, during the voting I noticed a strange discrepancy or dissonance between the jury and audience votes. Eurovision has strange voting rules, which have changed considerably over the years. The way points were awarded this year is through a somewhat complex process. 50% of points are awarded by national juries while 50% come from audience votes. The jury is there to ensure points are awarded to ‘good’ songs. According to the official rules, a jury must consist of five members from the music industry (singer, DJ, composer, lyricist or producer) and must have a fair balance of age, gender and profession. Their job is to evaluate the vocal capacity of the artist(s), the performance, the composition, and the originality of song. This year 37 countries participated, this means there were 37 juries (one for each country).
For each country 50% of their votes (or points) comes from the jury. The remaining 50% comes from the audience. The audience votes through SMS, by calling in, through the official app, or the voting website. Basically, the audience is you and me, regular people, anybody can vote (although it costs to vote). To summarize, the jury is composed of professionals, while the audience is ‘normal’ people.
Disagreement between the jury and audience
What I noticed this year (and partially also last year) is that the tastes of the jury and audience are starting to diverge. For instance, this year Croatia 🇭🇷 got only 11 points from the jury, but 112 from the audience. They were ranked 25th by the jury, but 7th by the audience. Similarly, Spain 🇪🇸 got 95 points from the jury, but only 5 from the audience, who ranked it as the worst song
To understand this in more detail lets look at votes from the past 3 competitions (2021, 2022, 2023) Voting data comes from the Eurovision world website (fan community) and allows us to unpack voting preferences between the jury and audience.
Data for 2021 competition
![]()
In 2021 there had a good agreement between the audience and jury votes. It has a rank correlation of R~0.64. An R=1 means perfect agreement, an R=0 means no agreement whatsoever, and R=-1 means opposite rankings, i.e. countries being ranked 1st by one party and last by the other. In the fig above, the red line denotes the diagonal. I.e. the area where jury and audience agree on the ranking. The farther away a country is from the diagonal the more the jury and audience disagree. Countries that appear in the red shared area ranked higher by the jury, while countries that appear in the white area are ranked higher by the audience.
Here, already some things stand out, the jury had Switzerland🇨🇭 as the best song, but the audience ranked it 6th. Similarly, the jury ranked Italy🇮🇹 4th (which won the competition 🏆) while they were ranked 1st by the audience. But overall there was an respectable overlap between the rankings.
Data for 2022 competition
![]()
In 2022 the spearman correlation fell to R=0.38, meaning the jury and audience disagreed more on what constituted a ‘good’ song. In fact they only agreed on one country Spain 🇪🇸 (ranked 4th by both). The jury though the UK 🇬🇧 had the best song, while the audience voted for Ukraine🇺🇦.
Data for 2023 competition
![]() For 2023 the correlation decreased even further, to R=0.25. (Remember R=0 means no agreement at all, i.e. rankings are random compared to each other).
If jury and audience agree, countries will lie on the red line. However, we here see many countries lying on a line perpendicular to it.
This implies anti-correlation. E.g. countries are ranked high by the audience and low by the jury, or vice versa.
This includes Estonia🇪🇪 Australia🇦🇺 and Austria🇦🇹 (ranked high by jury, low by audience), and Croatia🇭🇷 Poland🇵🇱 Norway🇳🇴 and Ukraine🇺🇦 (ranked low by jury, high by audience).
For 2023 the correlation decreased even further, to R=0.25. (Remember R=0 means no agreement at all, i.e. rankings are random compared to each other).
If jury and audience agree, countries will lie on the red line. However, we here see many countries lying on a line perpendicular to it.
This implies anti-correlation. E.g. countries are ranked high by the audience and low by the jury, or vice versa.
This includes Estonia🇪🇪 Australia🇦🇺 and Austria🇦🇹 (ranked high by jury, low by audience), and Croatia🇭🇷 Poland🇵🇱 Norway🇳🇴 and Ukraine🇺🇦 (ranked low by jury, high by audience).
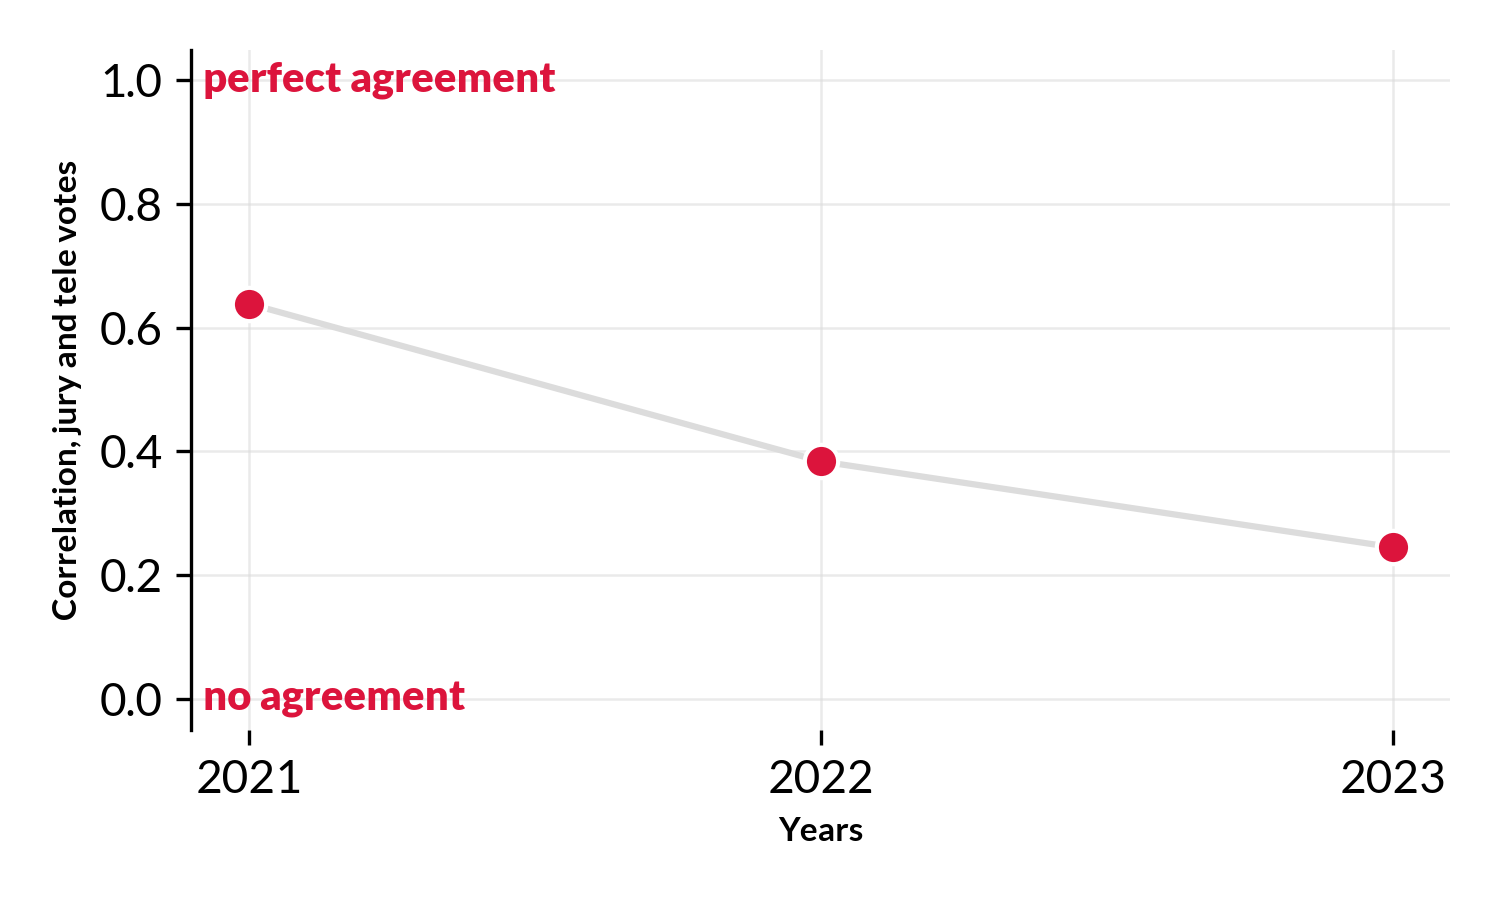
Looking across the last 3 years (all the data we have) we see years that the the correlation (alignment) between the two groups has dropped markedly, from a good alignment to almost no alignment whatsoever. Maybe its time to rethink the voting at Eurovision? Maybe its time to remove the jury and go back to a fully democratic process (i.e. points are 100% awarded by the audience). In 1998-2000 Eurovision actually (experimented with this)[https://twitter.com/TAledavood/status/1658200092472426496], I’m not sure about the outcome of the experiment and why they reverted back to jury votes/points.
What causes these differences and future studies
It is unclear what has caused the difference between audience and jury to grow. One explanation could be that the populations have changed, i.e. what regular people think is a ‘good song’ and what musicians is a good song could have diverged. Another explanation could be that the size differences between the populations could cause these fluctuations. For example, the jury consists of only 5 people, so an single (grumpy?) juror can easily influence the overall vote of the jury, potentially introducing a lot of noise. On the other hand, the audience potentially consists of millions of individuals, where the sheer number of people can ‘average out’ the noise.
It could be interesting to model these effects, and look into how much noise thee is a jury votes, and possibly build a machine learning model to predict audience votes from different song characteristics. If I can convince one of my students, it could be a fun project.