The next big thing....
Is just around the corner! We have some cool results that hopefully should be published soon. Until then here are two teaser pics.
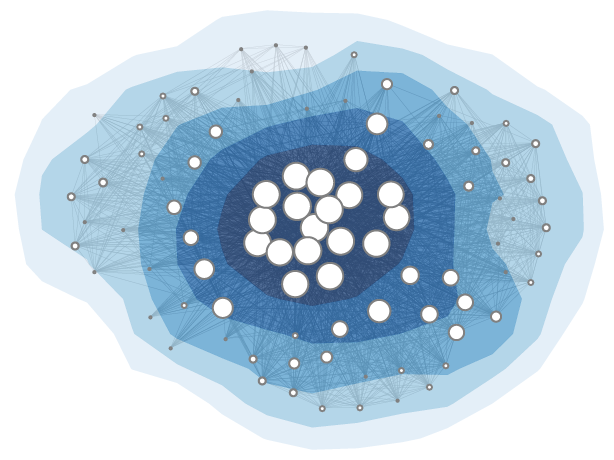
1) Focusing on individual node participation levels we look at community detection from a new angle. Inspired by the visualizations of Axelsen et al. we can plot social gathering according to how much time each person participates in a group and get these stunning contour networks.
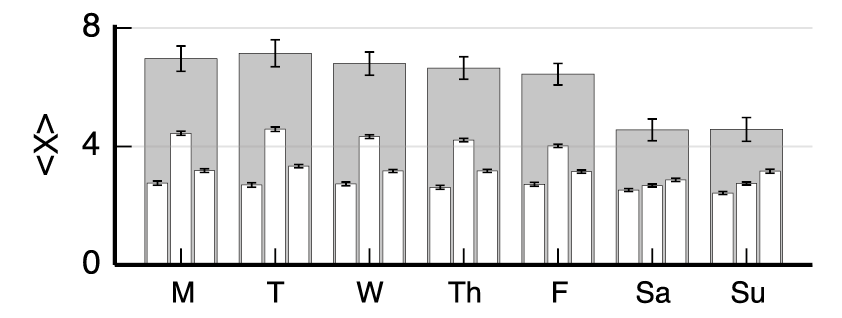
2) Nested histograms! Unable to decide whether we should plot data in daily or 8m-hour bins, we choose to to both—producing these cool histogram structures. They allow some arbitrary quantity X to be plotted with respect to multiple temporal resolutions.